A Pareto chart is a special kind of graphical presentation. We can also call it a hybrid graph in which bars and lines are used simultaneously. This not only gives a broader perspective on the graph for the viewers but also explains the elements and factors in a better way. This is a chart in which the individual values are shown in the bard in descending order and the cumulative total is given on the line graph at the top of each bar. This technique was invented by Vilfredo Pareto to be used for business purposes and thus it’s named after him as Pareto chart.
Importance of Pareto Chart:
There is a lot to explain in describing the importance of Pareto charts and as a businessman, you can see and understand the importance and significance of Pareto charts for your company but as an individual, it is quite a phenomenon to understand. First of all, the Pareto chart describes each problem in a business in separate ways so it is easy to understand even for those who don’t understand the business much. Secondly, this chart sorts out all the problems and ranks them so that you can focus on the most crucial problem and leave the less important ones for some other time.
Moreover, the Pareto chart not only provides inside information about the possible obstacles and problems with your business but also forecasts the after impacts if you make any changes to eliminate the problem. For example, if you want to eliminate a problem, you can either go with scenario A or B and the Pareto chart gives you a future picture of each scenario so that it is easy for you to pick a less risky option.
Business Pareto Chart Example


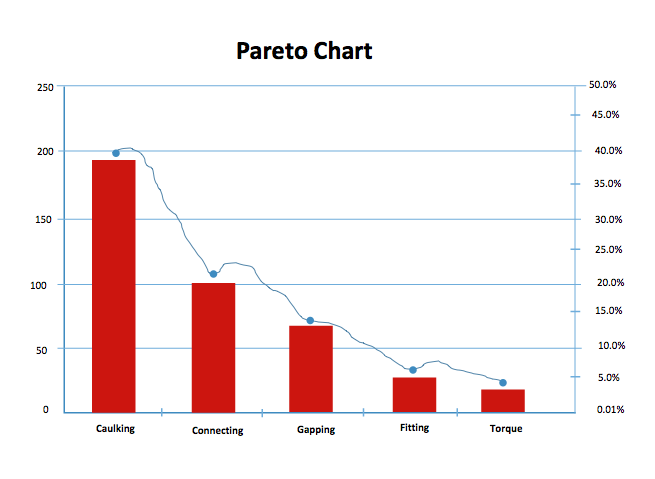
Pareto Chart Quality Control

Six-sigma Pareto Chart Problem Solving

Editable Pareto Chart Excel Template

Analysis Pareto Chart Example

Simple Pareto Chart
Application of Pareto Chart in Business:
Pareto charts are used worldwide in businesses, companies, and global organizations. No matter what kind of company you are running, if it offers products or services of any kind, you have the option to use the Pareto chart technique in your business to improve production, lower the risks, and eliminate delays along with any possible problems in the final product. Pareto charts help businesses in many ways but most importantly, this chart explains the issues or problems that a business is facing and the obstacles that the production teams have to overcome to increase production.
As you know Pareto chart is also known as the 80:20 technique, which is a very common technique implemented by several global companies and organizations. With this technique, the Pareto chart defines the 20% of sources in your business or production that are causing 80% of the problems. This way you can easily allocate the problems in your business that don’t seem very bad otherwise but with the Pareto chart perspective, you will find potential in those tiny problems. This takes things to the next level where the Pareto chart explains and helps you to focus your efforts and hard work on a particular part of a project or process by which you can achieve your desired goals and objectives.